When Christopher J.L. Murray was 10 years old, he ran a pharmacy.
His parents moved his family from Minnesota to England, bought two Land Rovers, drove across the Sahara to Niger, and started a hospital.
His father was the physician. His mother was in charge of the in-patient wing. His older sister and brother helped with the patient care. And, at the age of 10, he ran the hospital pharmacy.

Through the experience in Niger and elsewhere in Africa, he developed a fundamental question: “what makes people sick?” Over time, this question became more refined and targeted: "What are the world’s major health problems?" And more specifically, "what diseases are people dying from?"
A few years later, Murray began studying health economics at Harvard to try and answer this question. But after years of research, he realized there was no obvious answer.
"Back then, well-meaning advocates for different diseases published death tolls that helped them make the case for funding and attention," explained Murray. "But when all the claims were added up, the total was many times greater than the number of people who actually died in a given year. And even when policymakers had accurate data, it usually included only causes of death, not the illnesses that afflicted the living."
Murray realized there had to be a better answer to his question, and he decided to spend his life trying to answer it. He and demographer Alan Lopez began creating a systematic, numeric way to quantify health problems in terms of deaths, life years lost, and years compromised by illness.
Compared in breadth and depth to the moon landing and the Human Genome Project, their research became known as the Global Burden of Disease project.
The problem with global health data
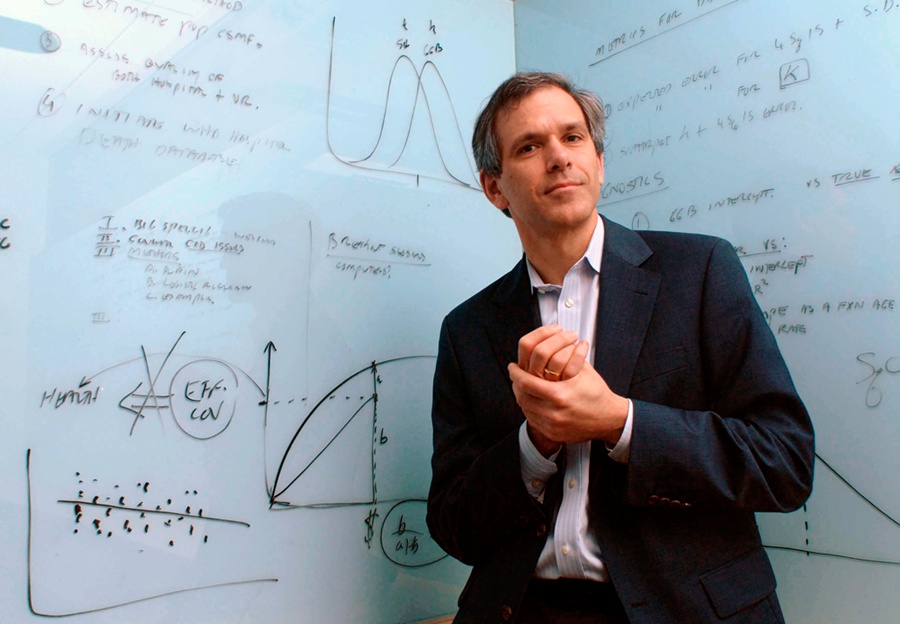
With a grant from the Bill & Melinda Gates Foundation, Murray expanded on his earlier research at the Institute for Health Metrics and Evaluation (IHME) in Seattle. Leading an effort with nearly 500 researchers from 300 institutions in 50 countries, Murray was working to figure out what people were dying from.
But as he grew the project, Murray ran into a big problem: some of the data was missing and some of it was incomparable. Each analyst from each country had applied their own model to assign causes of death and make diagnoses. Without universal standards, comparing the results of the studies was like comparing apples to oranges—the differences yielded an incomplete and imperfect picture of what people were dying from.
To make sense of all the data, Murray and his team turned to a surprising place for inspiration — The Netflix Prize.
The data behind movie recommendations
Less than a thousand miles away in Los Gatos, California, Reed Hastings, Netflix’s CEO, was trying to answer his own question: what movies do people want to watch?
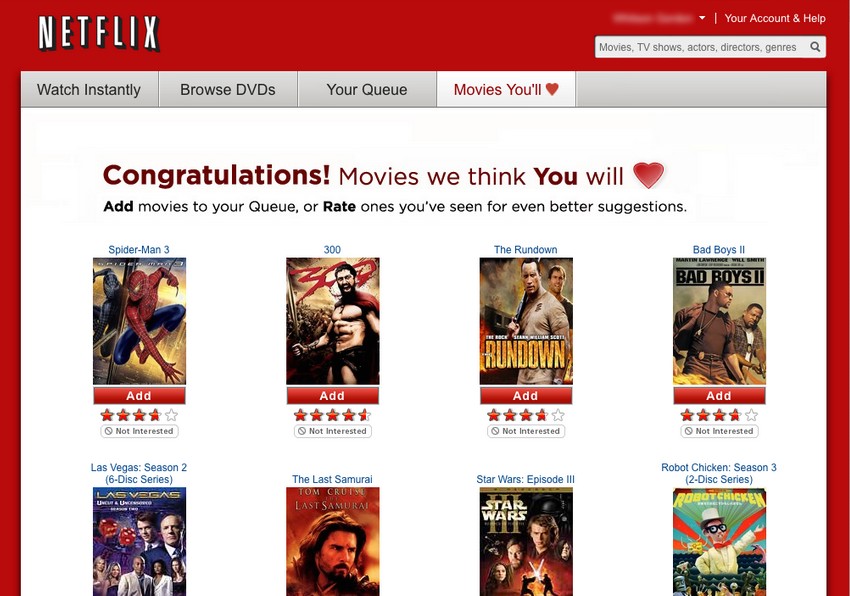
In 2000, the company had introduced Cinematch, a software embedded in the Netflix website that analyzed each customer’s movie-viewing habits and recommended other movies that the customer might enjoy. (Did you like “Pocahontas”? Well, maybe you’d like “Beauty and The Beast.”) According to Hastings, it yielded “a mix of insightful and boneheaded recommendations.”
Over the years, Netflix engineers made adjustments to improve the algorithm behind Cinematch and at one point, the system was driving a surprising 60 percent of Netflix’s rentals. This meant that for Netflix, a good recommendation system would do more than help users find new movies—it would also help them watch more movies. Without a strong recommendation system, users were using Netflix less often and were at risk for canceling their subscription altogether.
Netflix had to figure out how to improve the recommendation system and create a big picture answer to the question “what movies do people want to watch?” Their future revenue depended on it.
A 10% increase for $1 million
By 2006, Cinematch’s performance plateaued. Netflix’s programmers couldn’t improve the recommendation system anymore and they needed a solution.
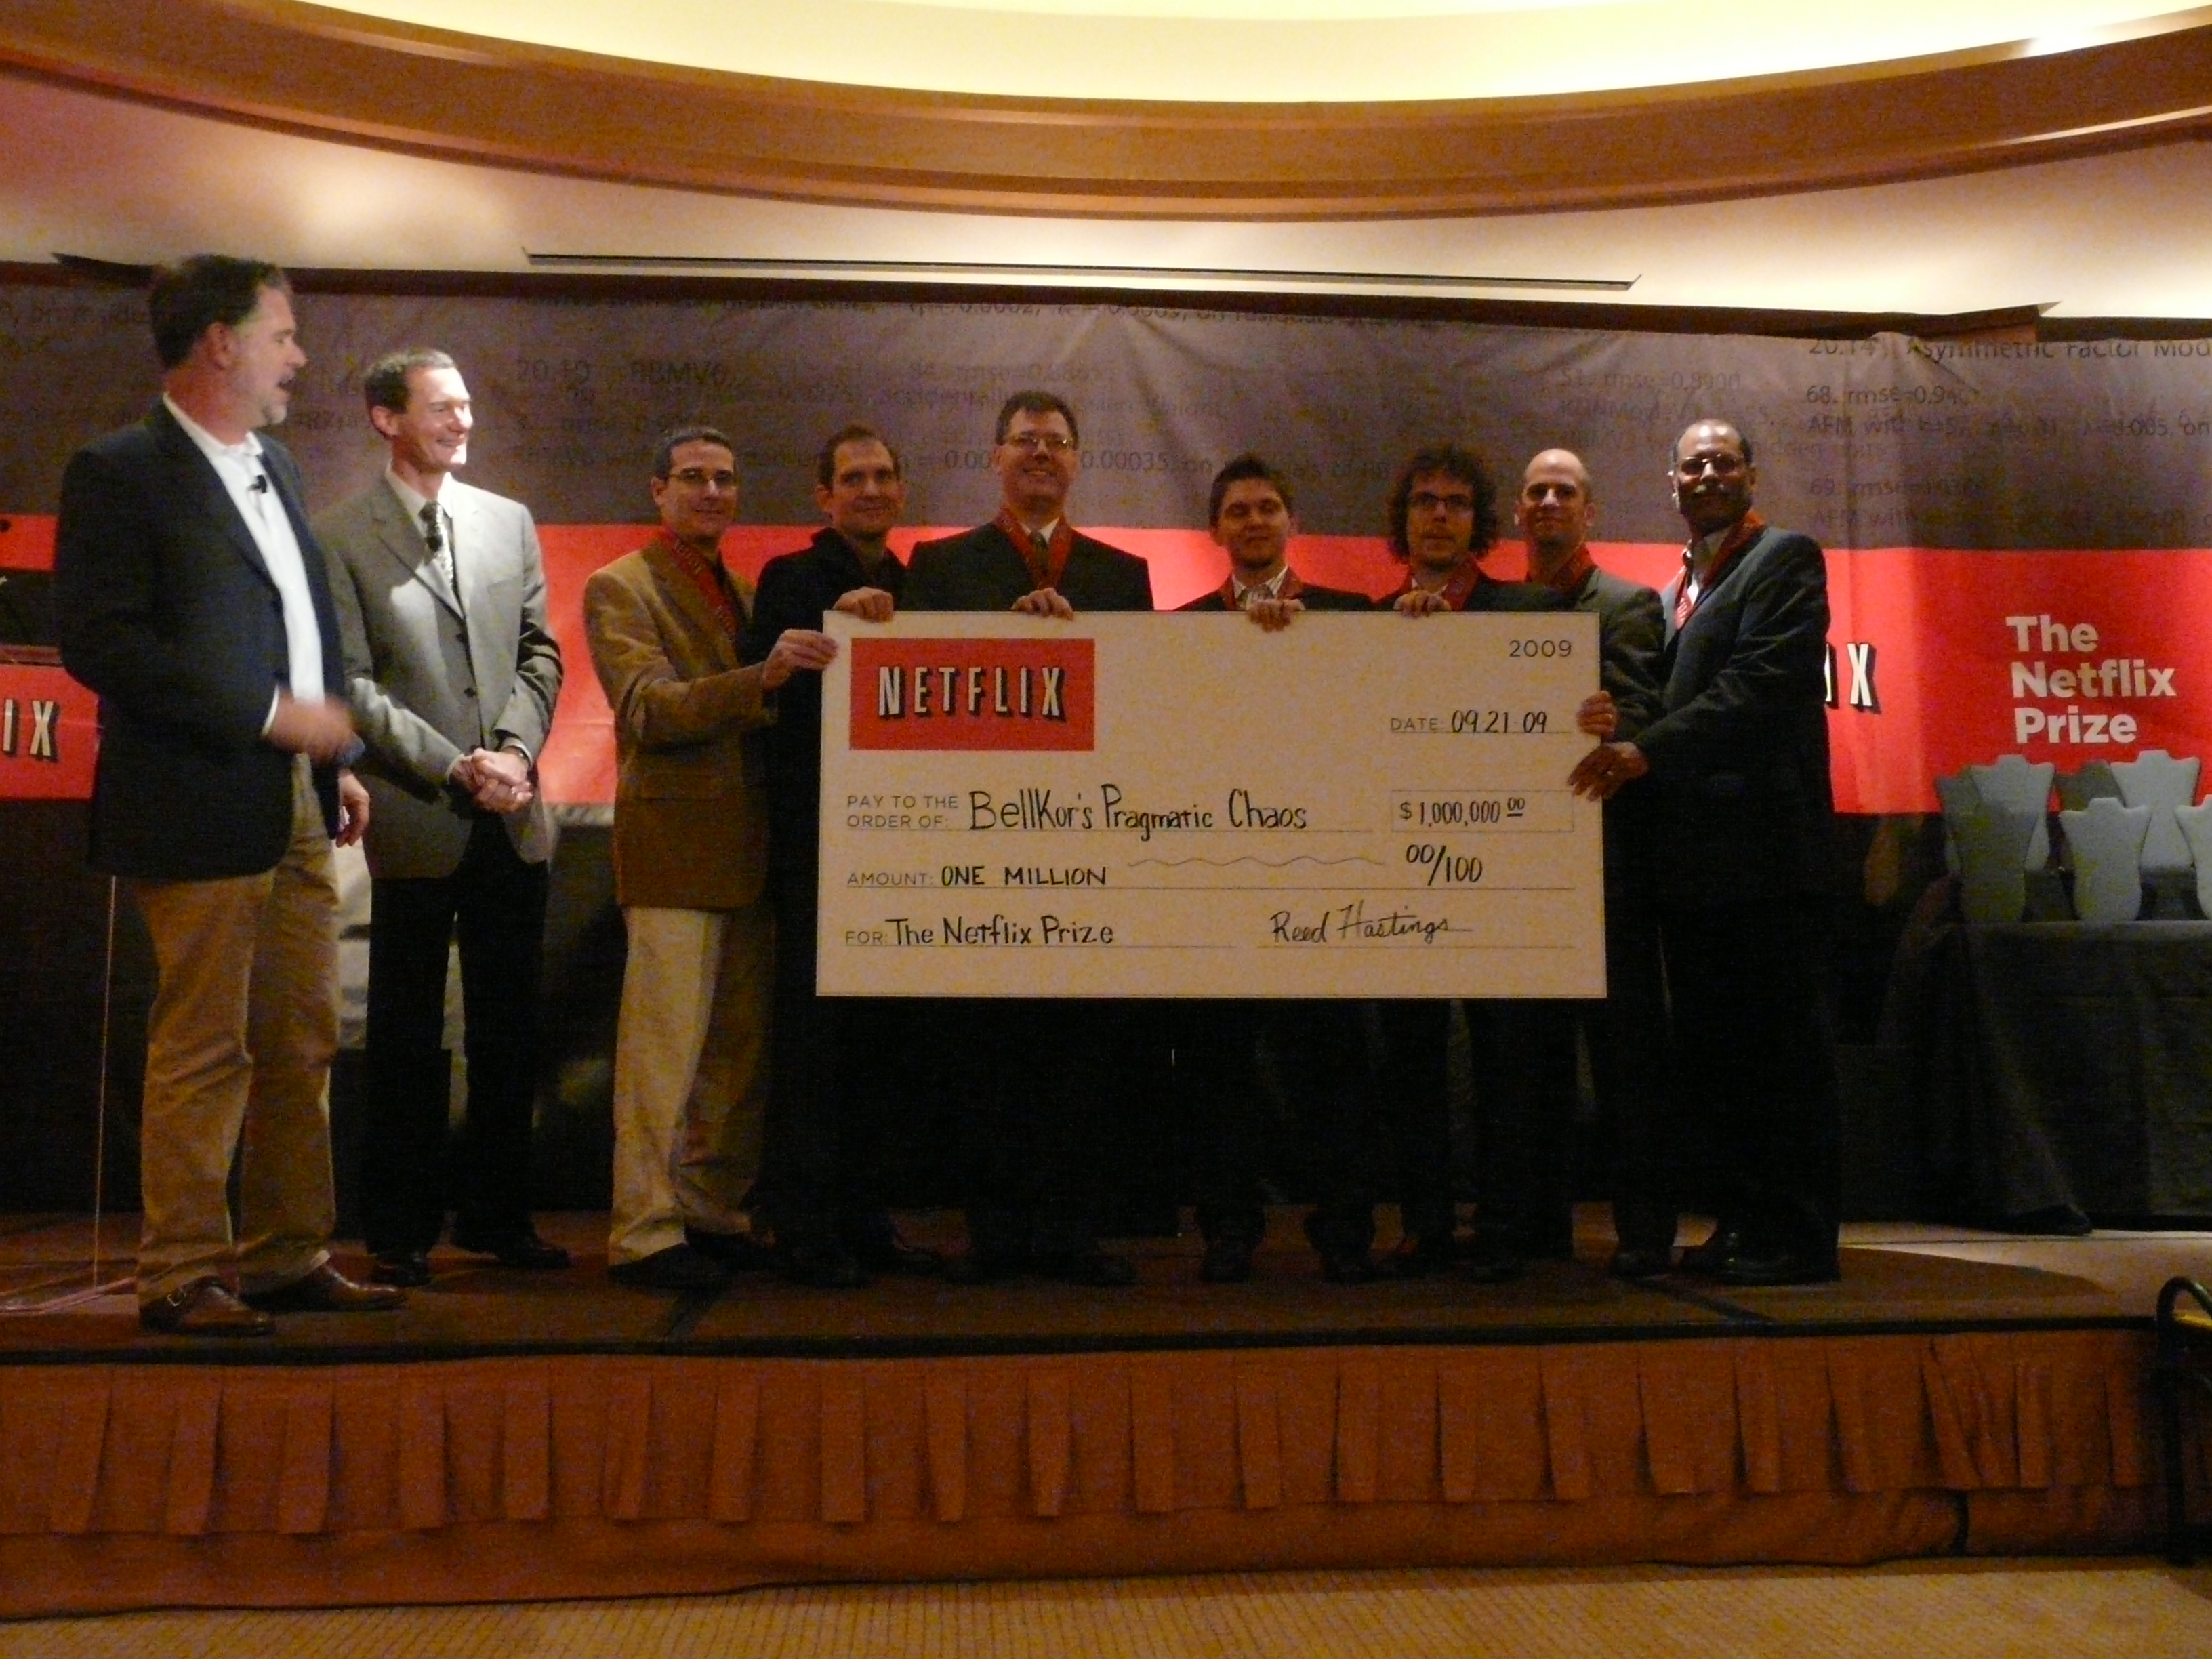
In October 2006, Netflix announced “The Netflix Prize,” an open competition to develop an algorithm that could improve Cinematch’s prediction accuracy by 10%. The grand prize was $1 million. If the winning algorithm could improve prediction accuracy on Netflix by just 10%, “it would certainly be worth well in excess of $1 million,” explained Hastings.
Thousands of teams from more than 100 countries competed in the challenge. After three years working on statistical models, the team "BelKor’s Pragmatic Chaos" was declared the winner in 2009.
The winning algorithm took a unique approach that at the time was not widely used: instead of applying a single statistical model to a huge data set (e.g. predicting a user’s preferences based on the preferences of similar people or recommending movies with similar characteristics), the team averaged the results of over 700 statistical models, an approach known as “ensemble modeling.” If the earlier algorithms were like puzzle pieces to understand nuanced decisions on movie recommendations, the ensemble model used these pieces to create a big, coherent picture of what Netflix users wanted to watch.
As Chris Volinsky, a statistician on the winning team explained, “the reason it was so effective was that when you take models that are very different and average them together, they're each able to figure out a different part of the problem. A model that predicts a user’s movie ratings based on the movie ratings that similar people gave (e.g. all 20-something women, all children under 10) might do well for some types of movies, and a model that recommends movies with similar characteristics (e.g. action movies, comedies, and movies with Tom Hanks), might do well for other types of movies. When you average them together, you get the benefit of all those different types of models. We realized the only way to win was an effective blend of models, not a new, single predictive method. This was a big surprise for everyone in the competition, including Netflix."
Netflix meets global health
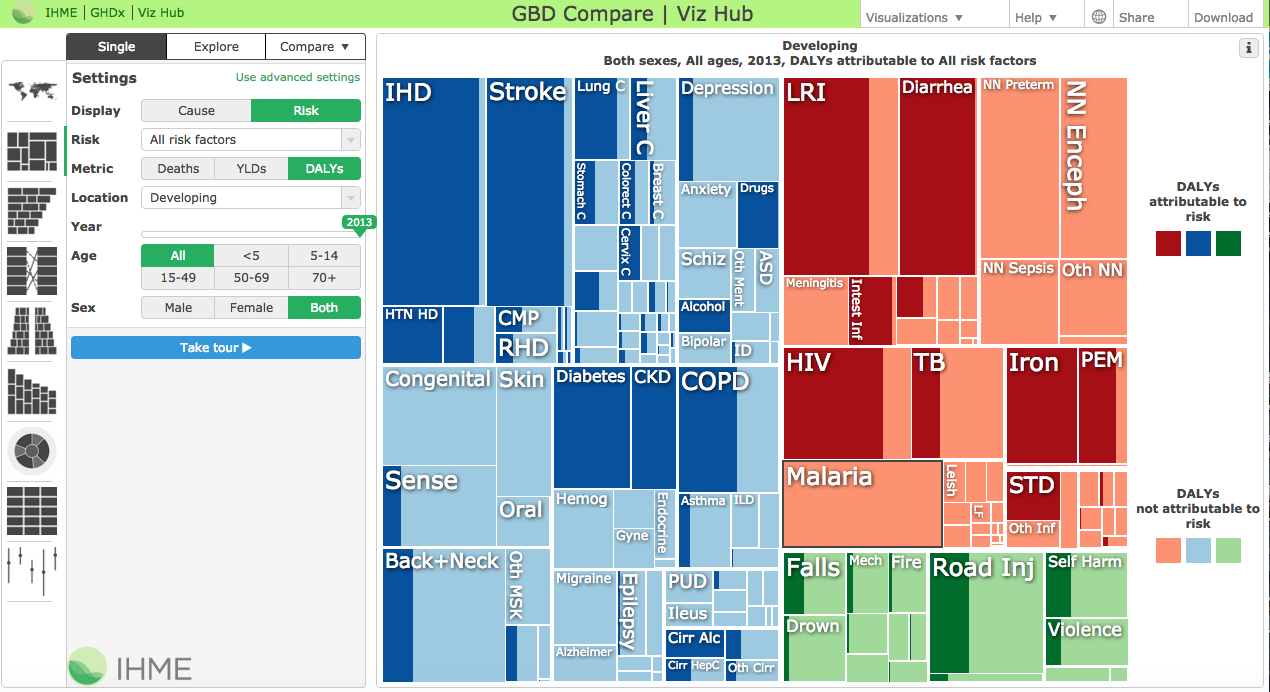
Back at IMHE, Murray and his team started digging into the winning Netflix algorithm. If Netflix could synthesize hundreds of statistical models to improve the accuracy of its system’s predictions, could Murray apply the same approach to global health data?
“The lightbulb moment for us was seeing how much better an ensemble of statistical models performed over choosing just one model to use for making predictions in health trends. For years, we’ve been trying a range of models and picking the best one. After seeing what the winners of the Netflix challenge were able to do to improve predictions in people’s movie preferences, we completely overhauled how we do disease modeling. We decided to apply the Netflix approach to cause of death modeling,” said Murray.
"We decided to apply the Netflix approach to cause of death modeling,” said Murray.
In 2012, Murray and his team began applying the Netflix model to global health data.
Nearly 600,000 deaths unaccounted for
After Murray and his team began to apply the Netflix algorithm, he started getting answers. And some were disturbing. The data showed that major decision-makers in global health had been miscalculating the global burden of disease and because of these errors, funding and resources were being misallocated.
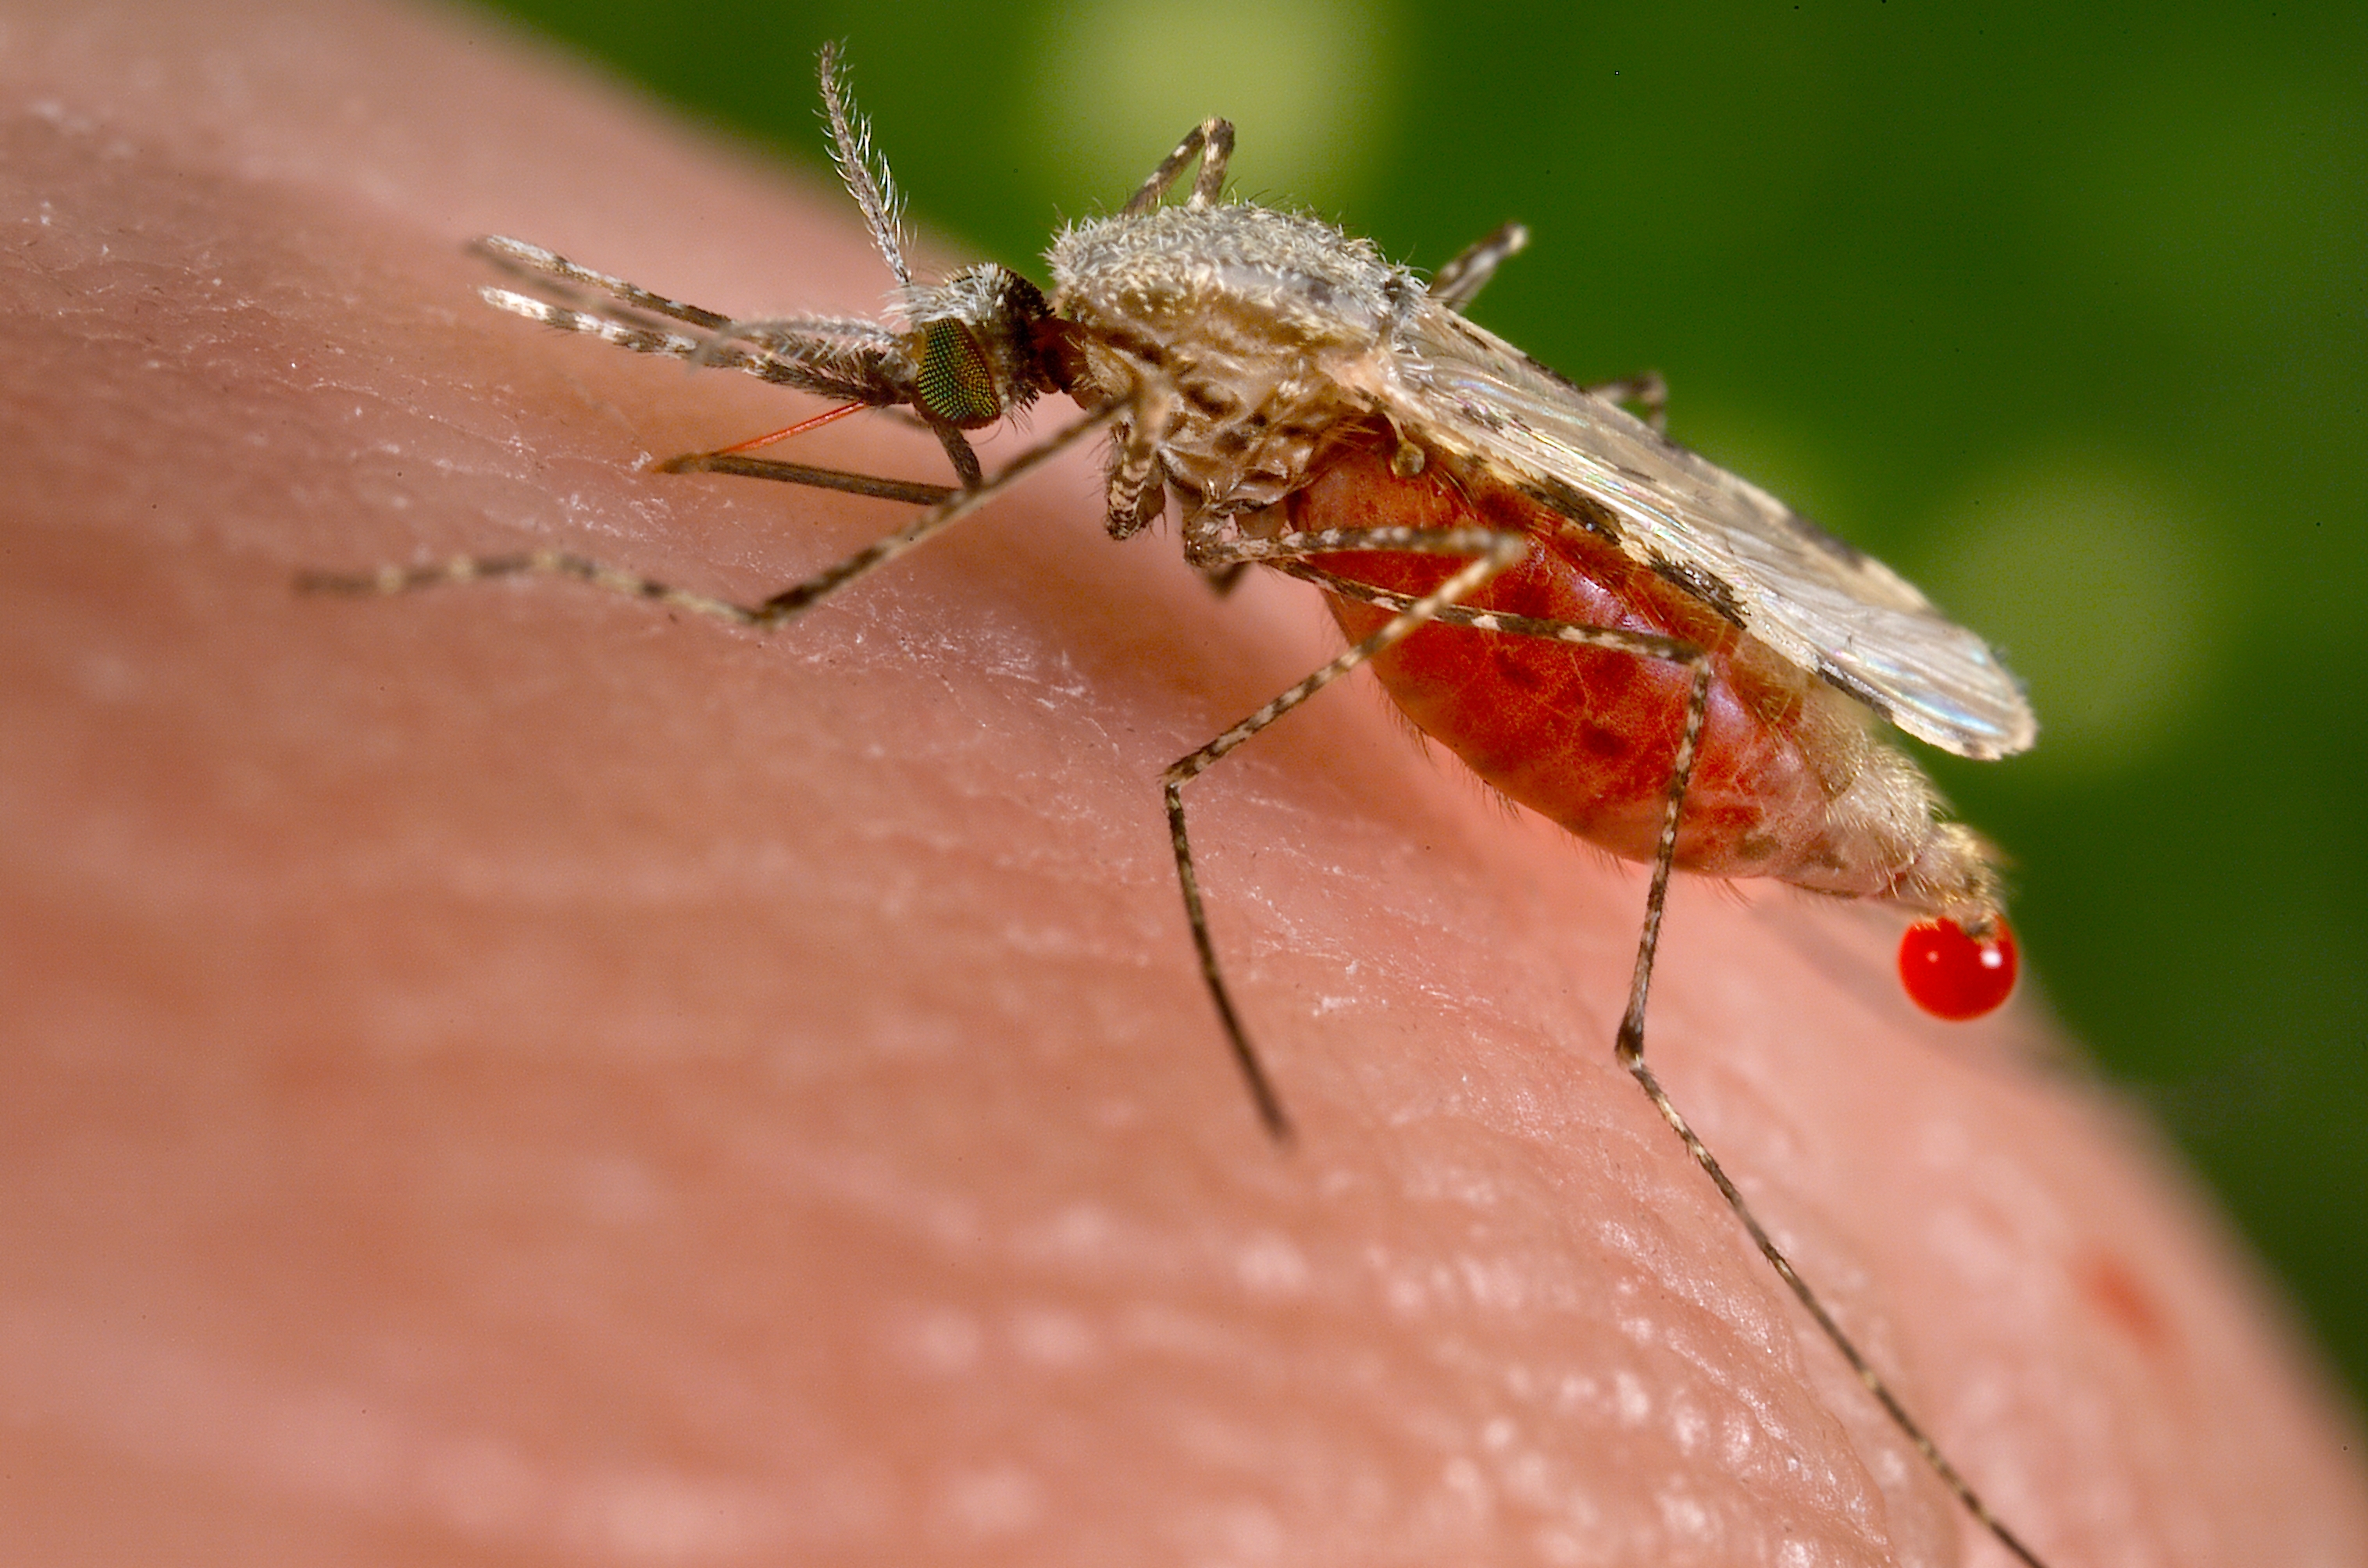
In a paper published in The Lancet in 2012, Murray and his team identified that there had actually been 1.24 million deaths from malaria worldwide in 2010—around double the 655,000 estimated by the World Health Organization (WHO) for the same year.
For some in the global health community, it was a wake up call.
"Although we can be grateful for these new estimates of malaria mortality," wrote the editors of The Lancet in a follow up to Murray's paper, "one important lesson from the science of estimation is that the urgency to revitalise health information systems has never been greater. We need reliable primary cause of death data to ensure that trends in malaria mortality are readily and reliably monitored—and acted upon."
The miscalculation of malaria deaths was one of several global health claims that Murray and his team went on to challenge using the winning Netflix algorithm. And with that, Murray’s initial, simple question turned into several larger ones: How can we allocate the same talent and resources that went into the Netflix Prize to global health? How can we use this data to limit the estimated $1.4 trillion in wasted global health spending every year? Since Murray published the malaria study in 2012, why has donor support for malaria research only increased by 2%? How can we put this data to the best possible use?
“We are living in a crucial time for our ability to accelerate progress in improving people’s lives,” explains Murray. “We have access to more data than ever before. We have the ability to make use of more computational power than ever before. And we are starting to see real improvement in the methods and tools used to estimate levels and trends in health.”
“I would like to think that 50 years from now we will have made even greater leaps, but I am realistic enough to know that progress can be slowed, too,” continues Murray. “Witness countries that once registered births and deaths and now no longer do. So even as technologies improve and more data are generated, we need to keep asking ourselves whether we are putting that data to the best possible use, which is to help people live longer, healthier lives.”
For Murray, we owe it to them to do just that.
Special thanks to Tom Paulson and Humanosphere for inspiring this piece. Humanosphere first covered the application of the Netflix approach to cause of death modeling in 2013.
Michelle Fernández
Telling the stories of Watsi patients and donors. Head of Content at Watsi.